|
How the Market is Moving
Financial markets don't simply move up and down.
They also change how they behave.
Verv measures this using three complementary views.
1. Market State
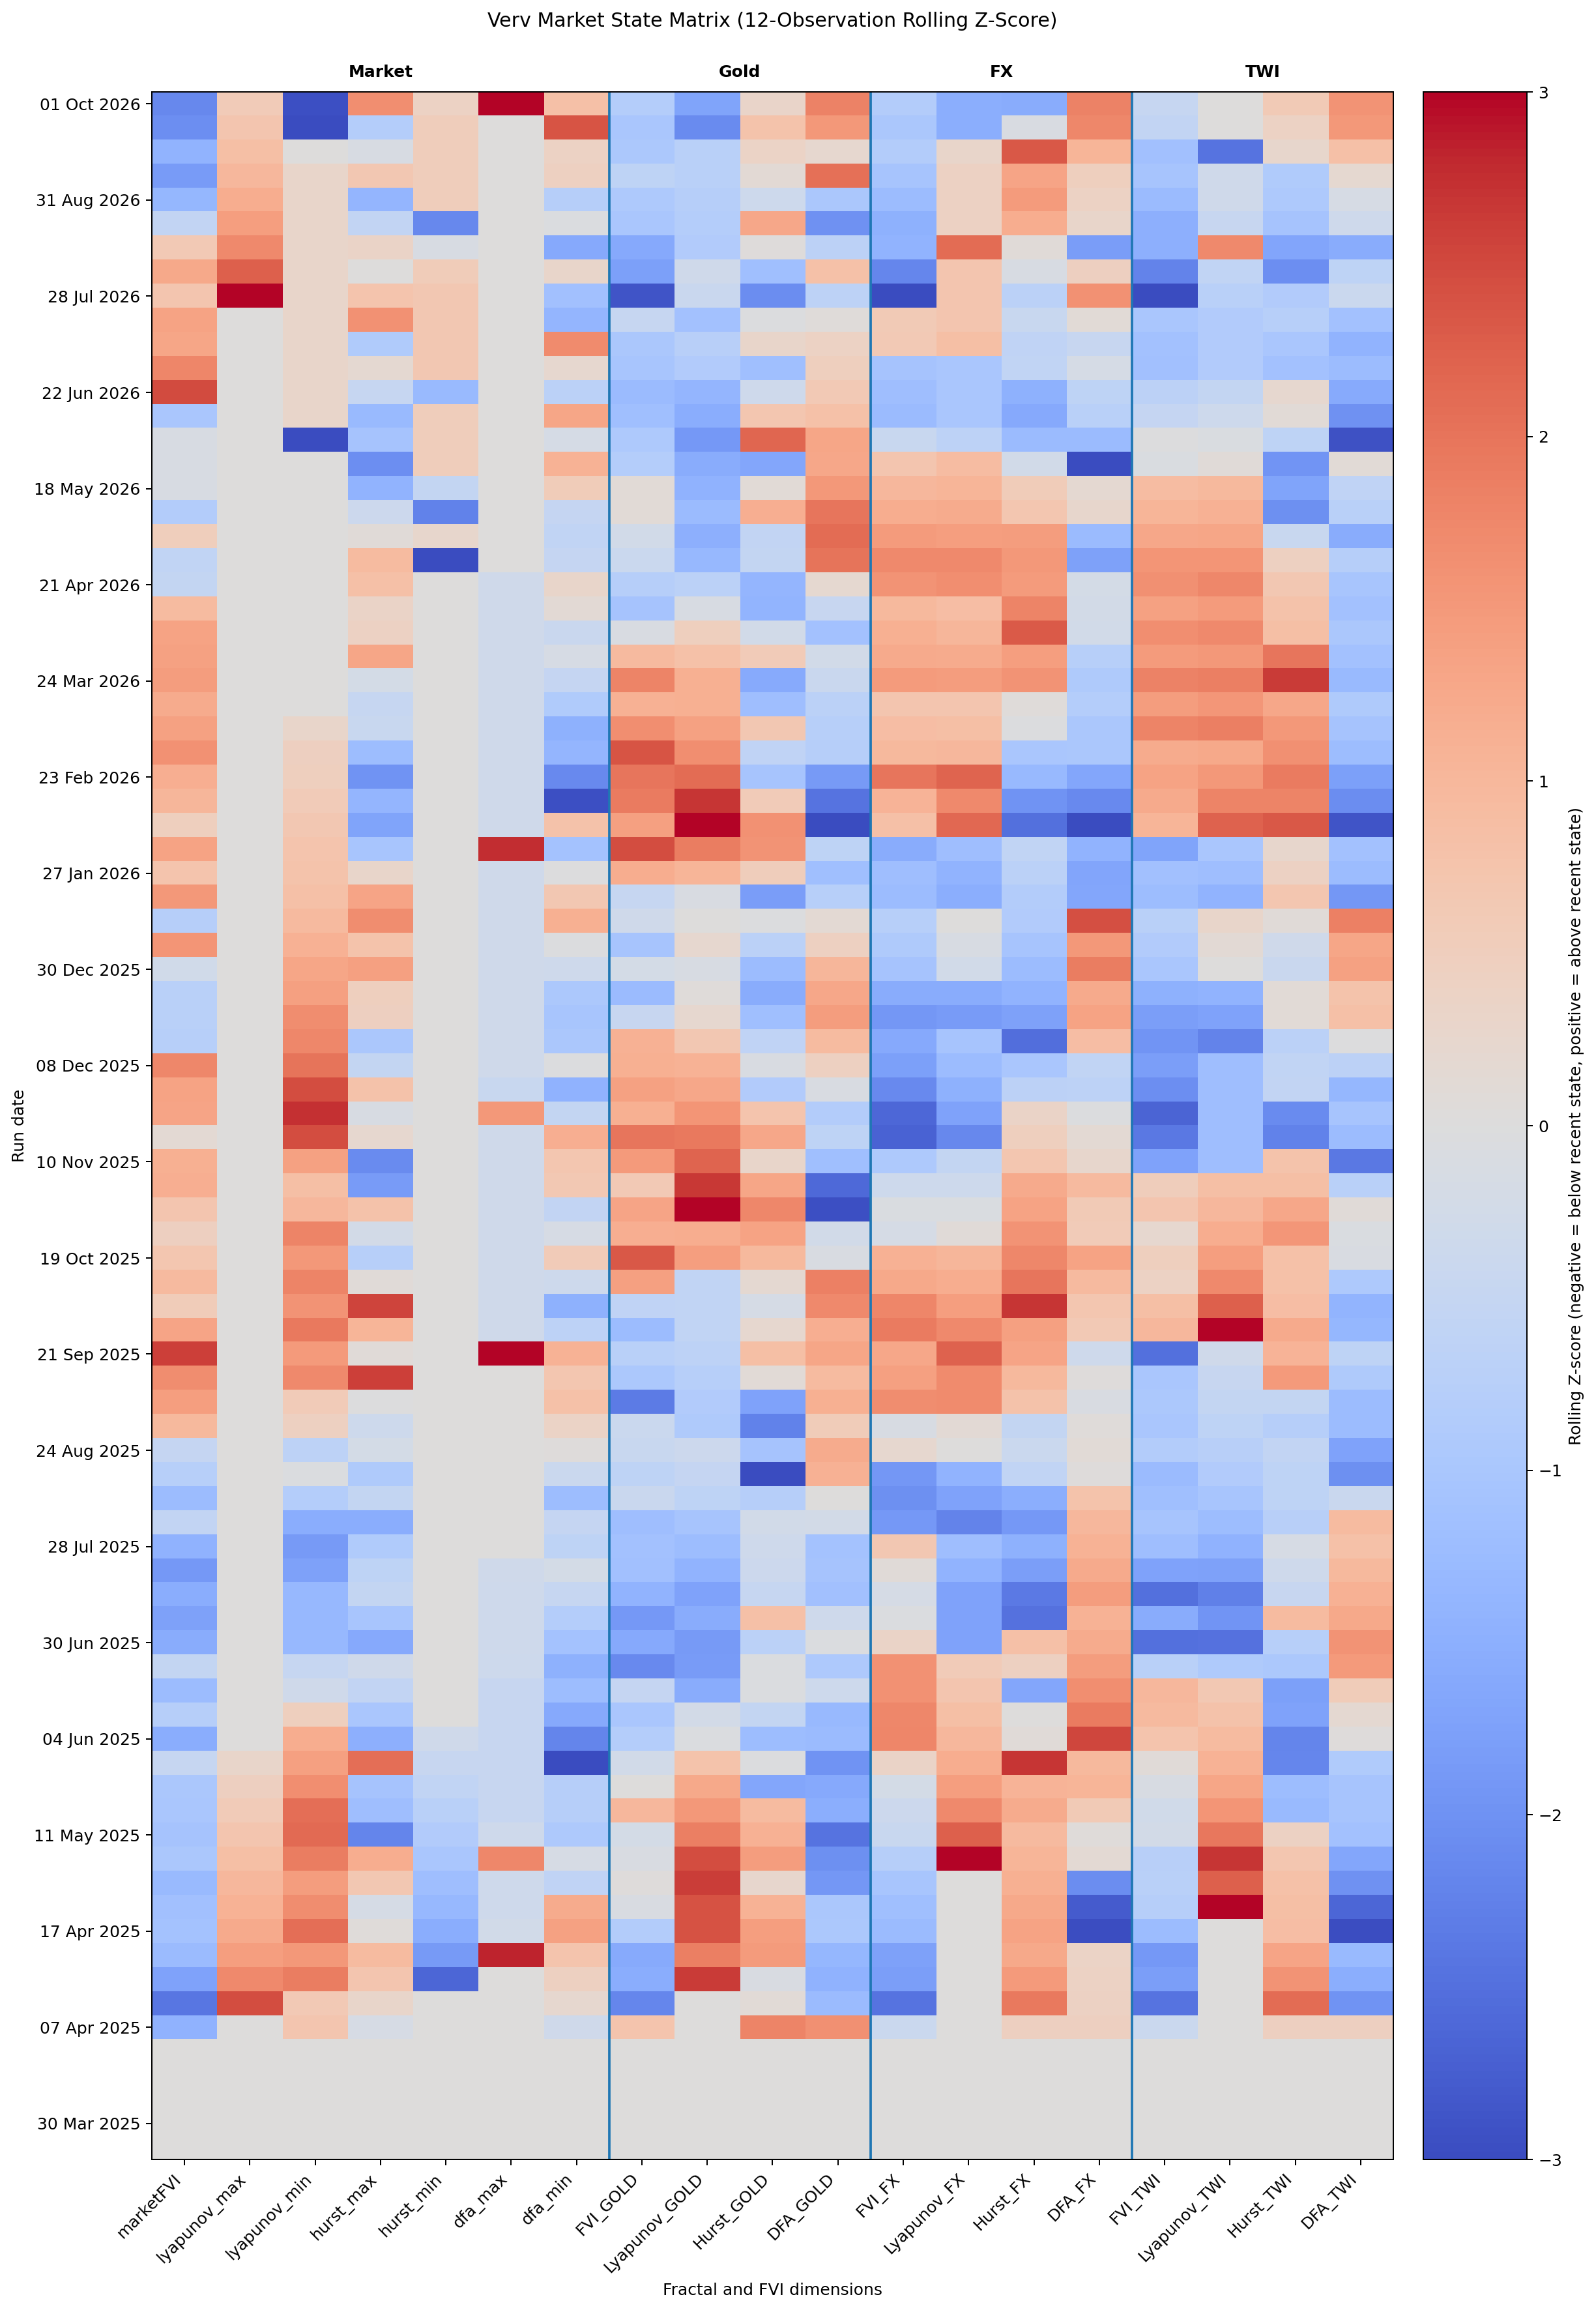
This shows the current structural state of the market.
Long coloured bands indicate persistent market regimes.
Sudden changes suggest the market is entering a different structural environment.
2. Market Transition
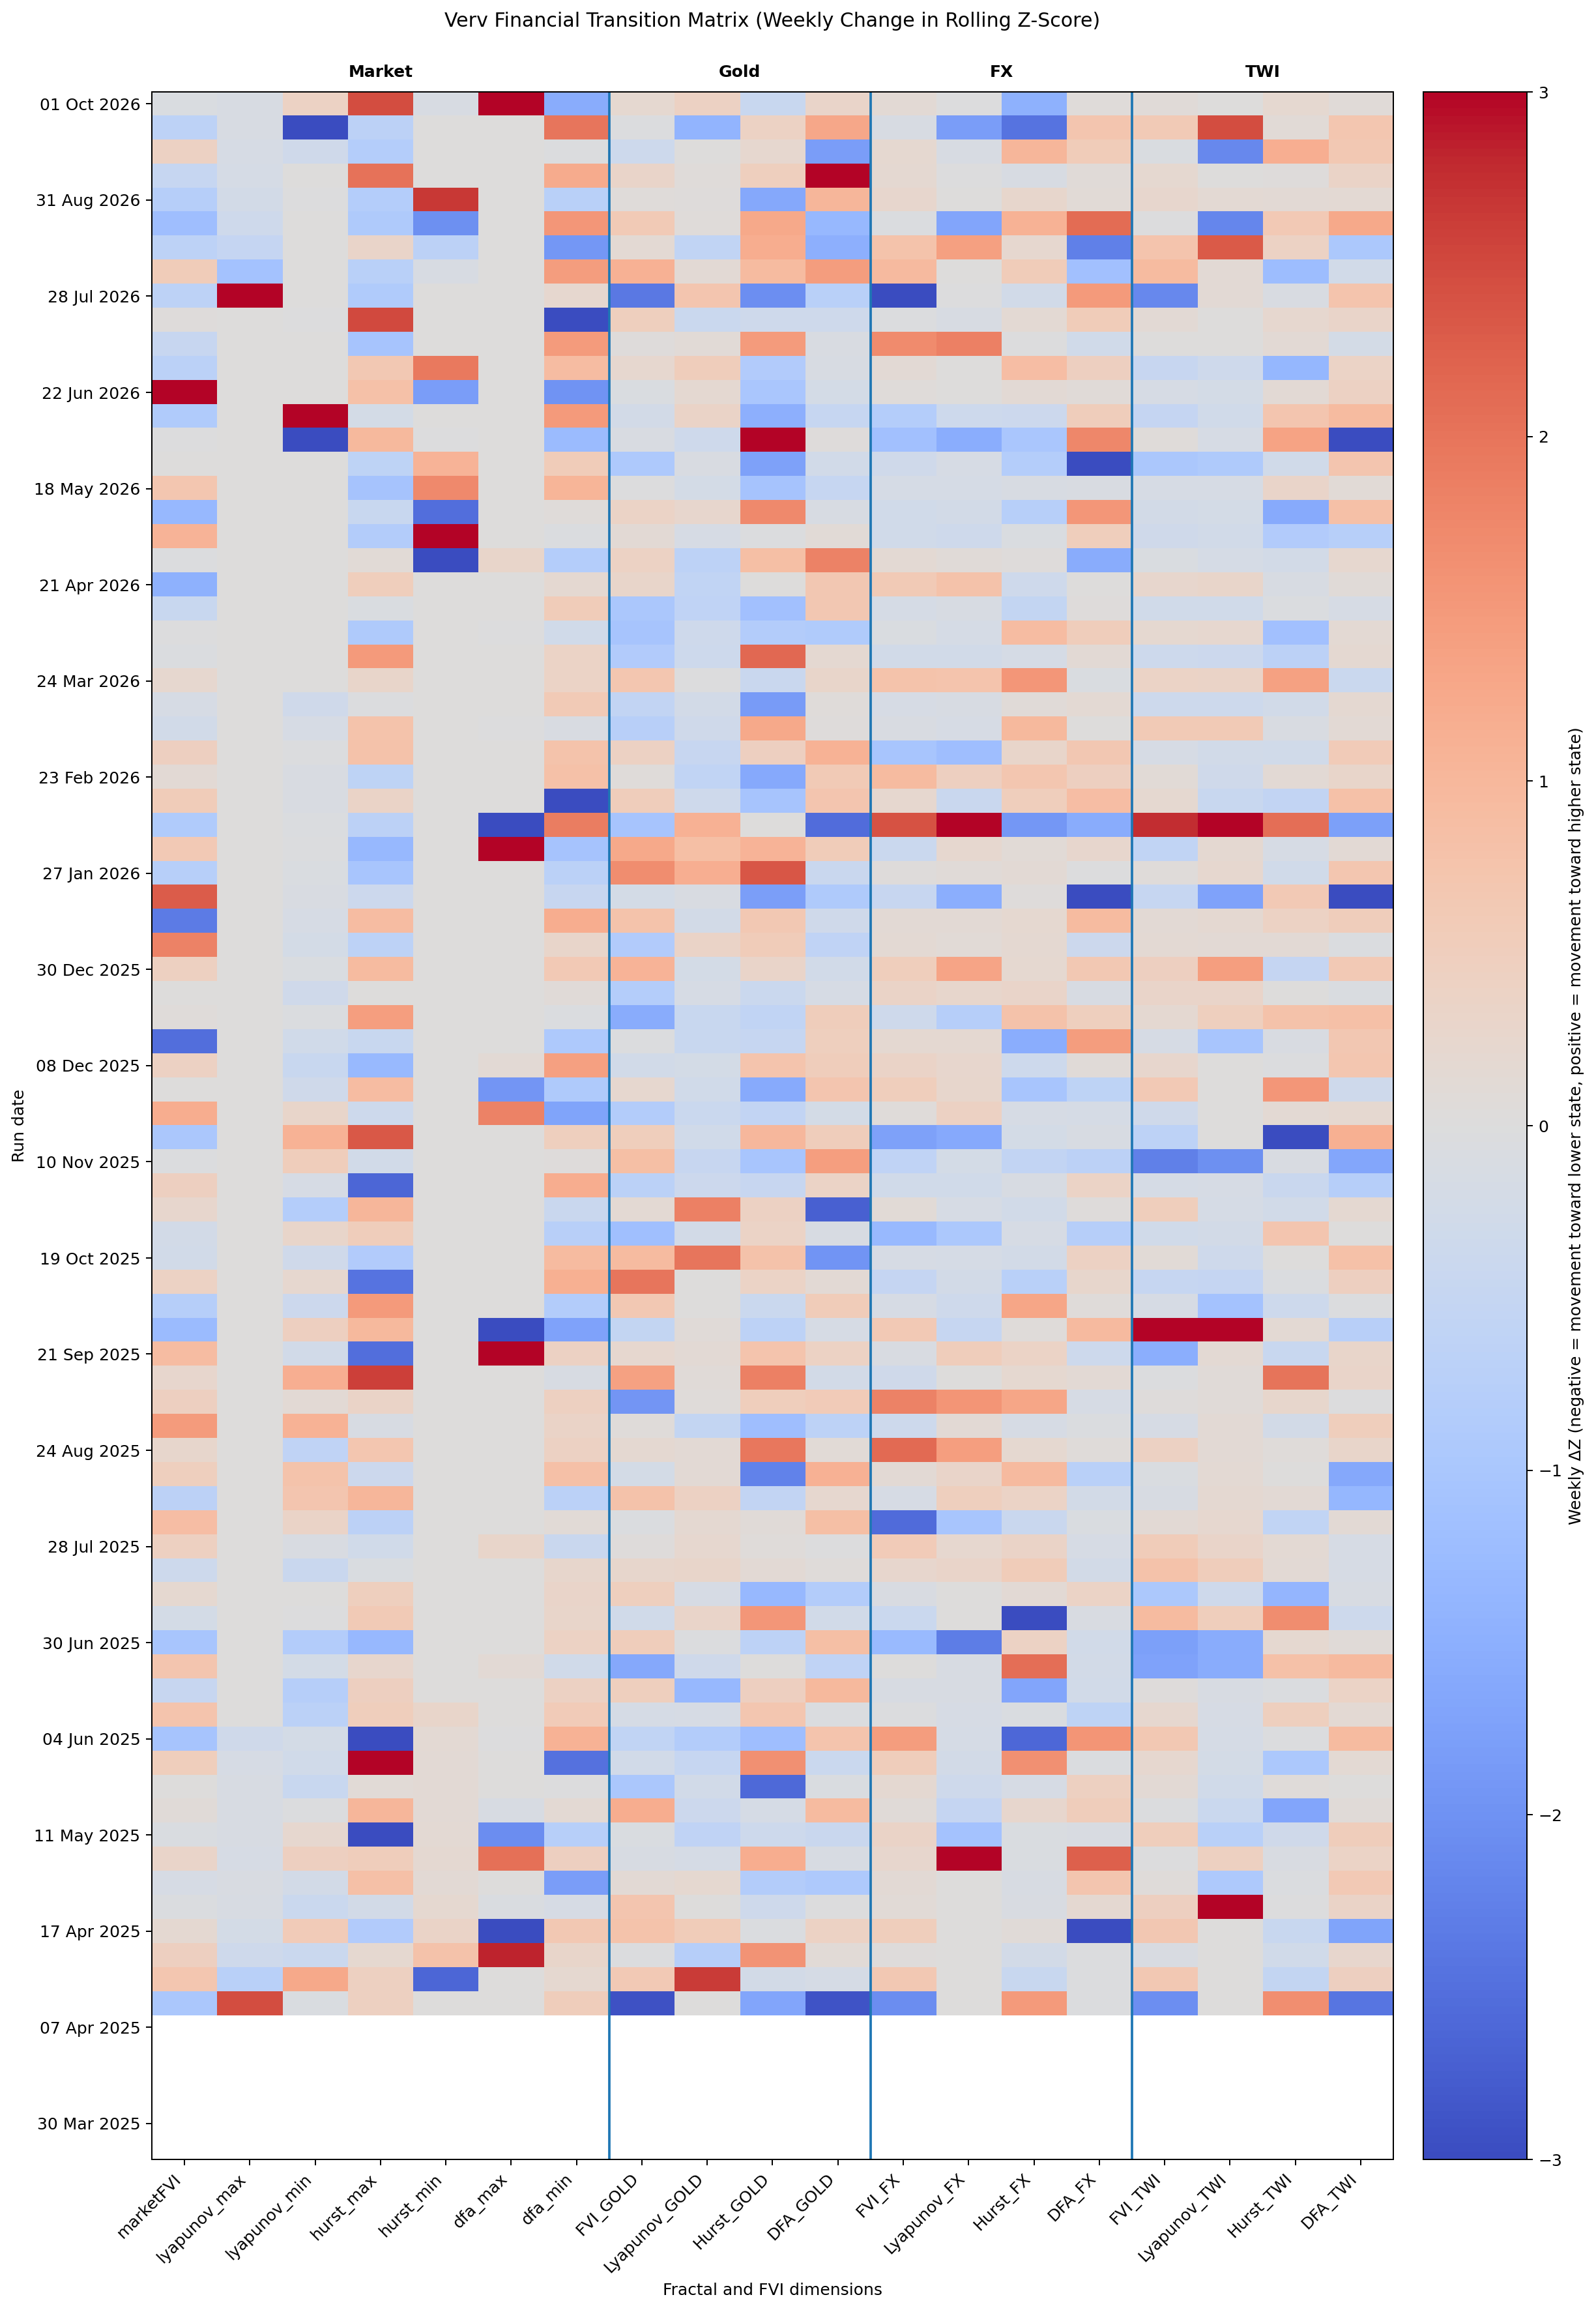
This shows how much the market changed from one week to the next.
Most weeks are relatively quiet.
Bright colours indicate periods where the market's underlying behaviour shifted more rapidly.
3. Market Acceleration
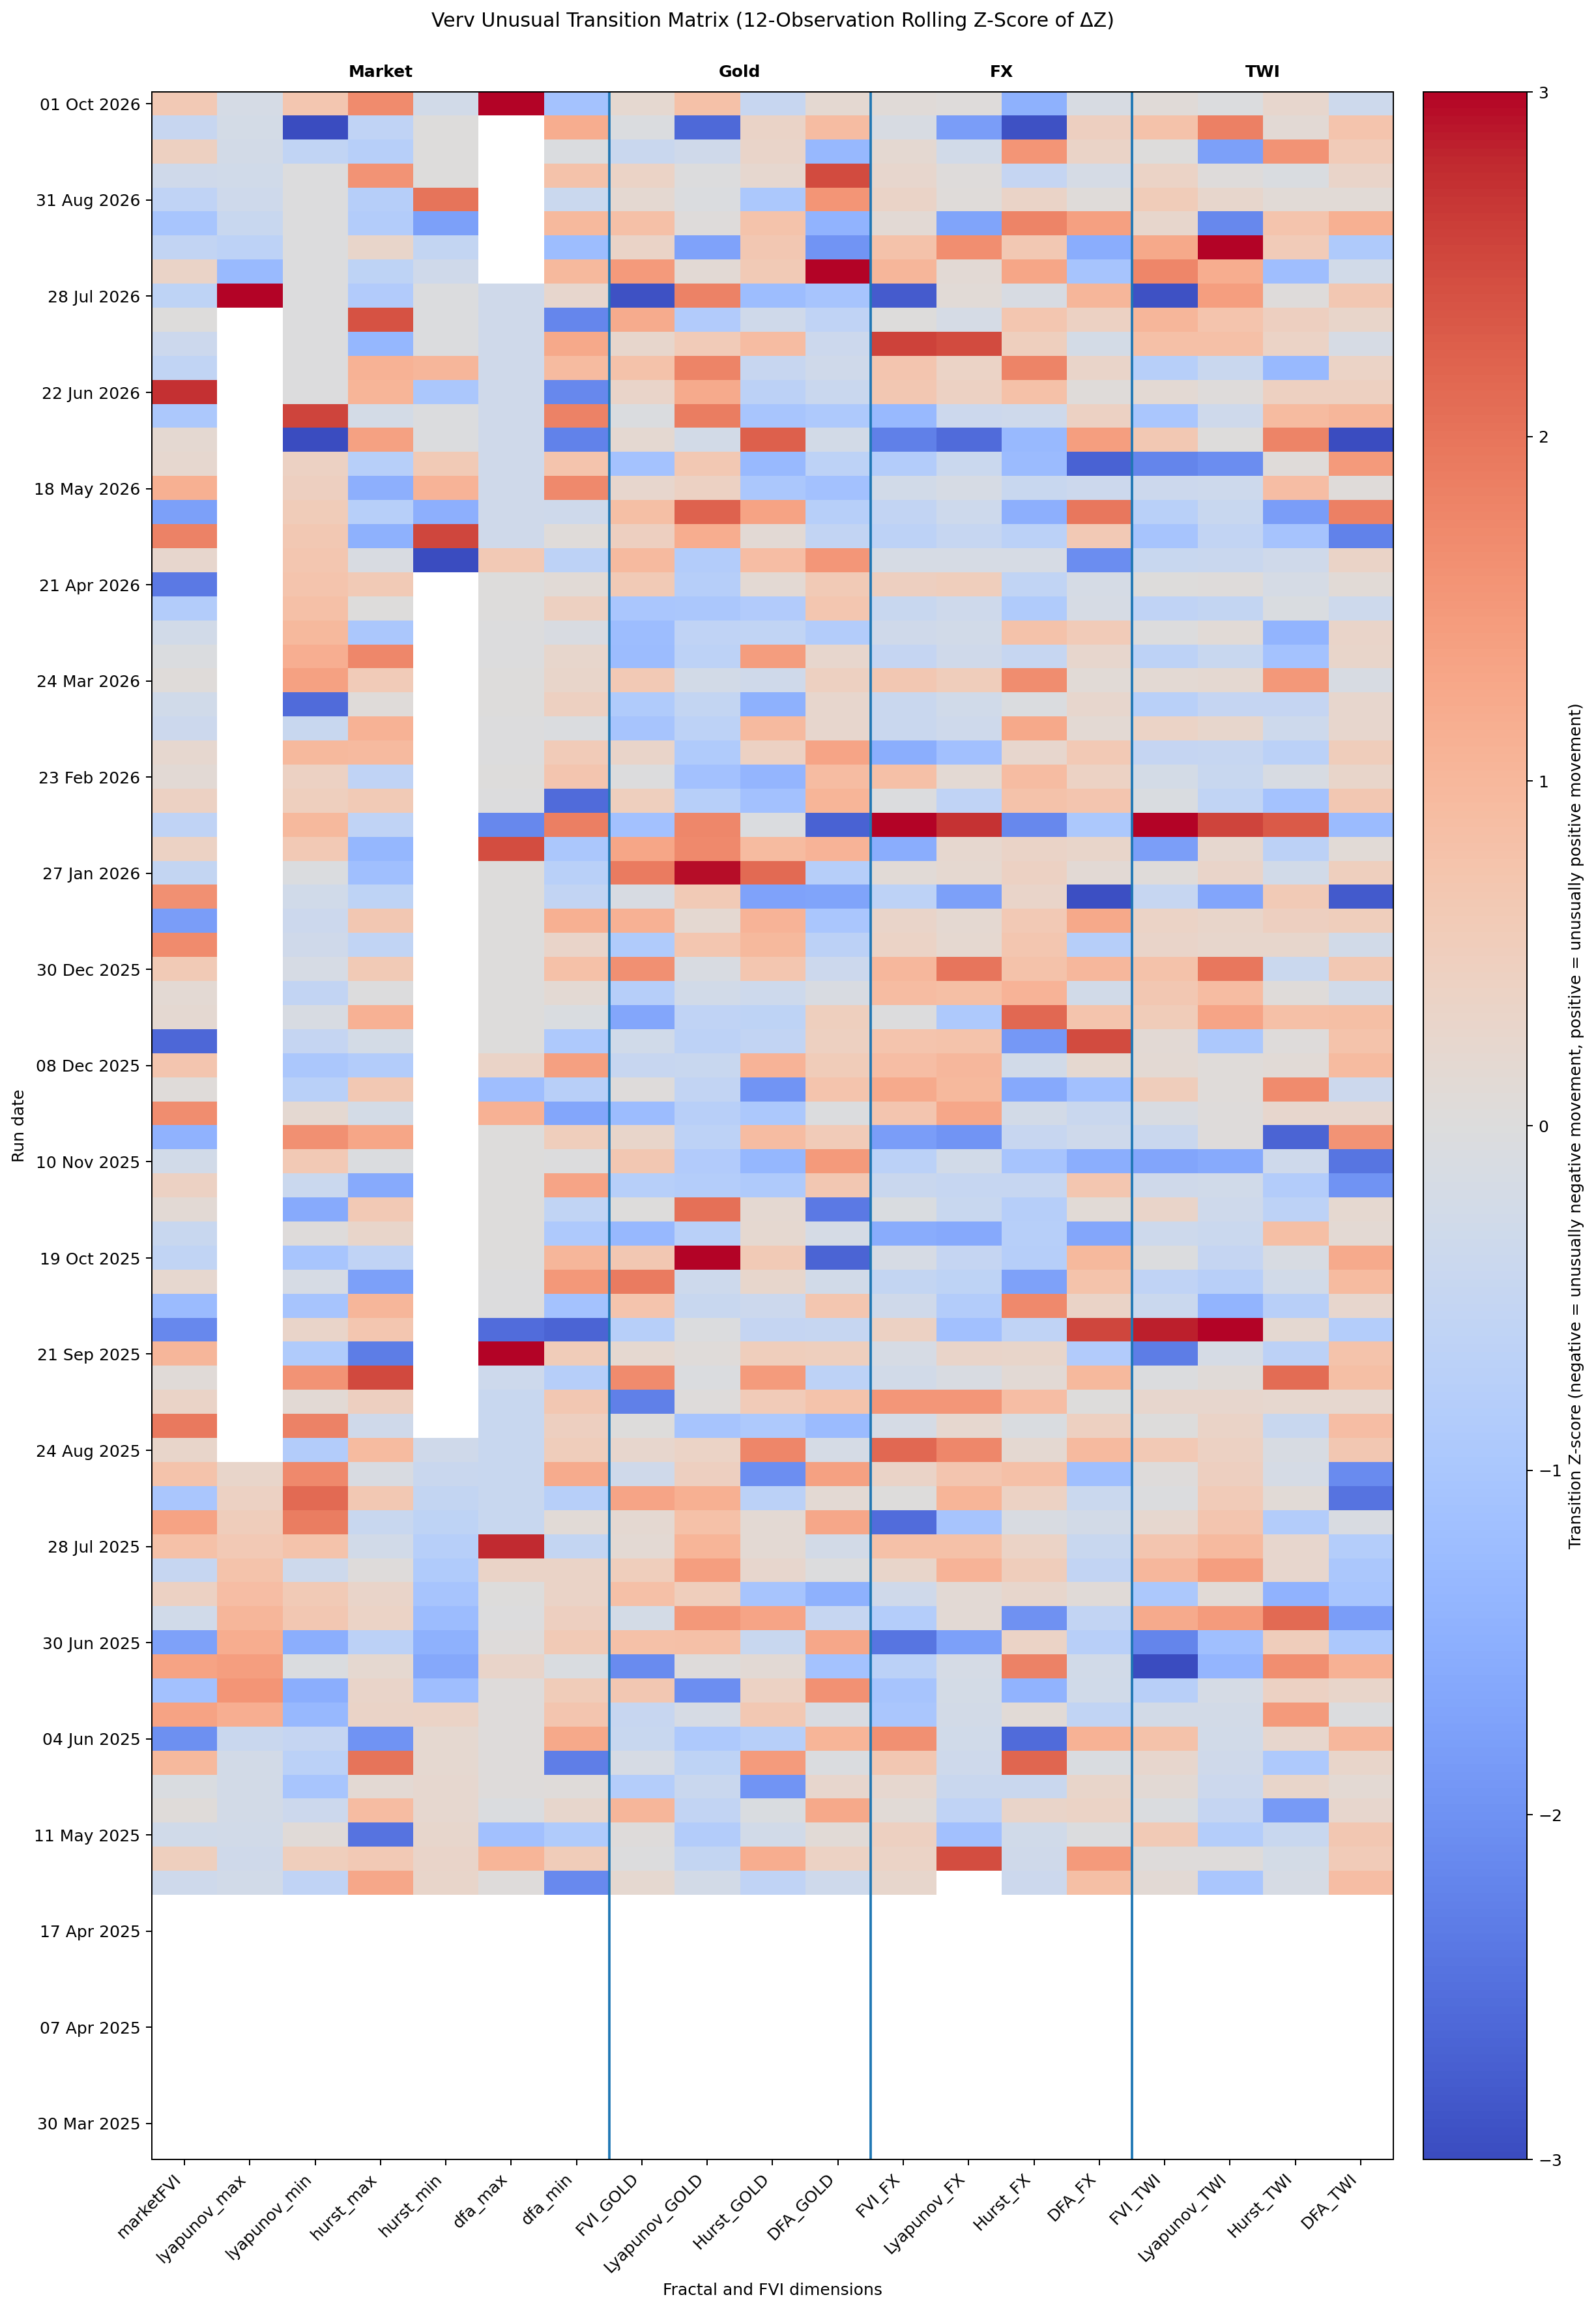
Not every market movement is important.
This chart highlights weeks where the structural change itself was unusual compared with recent history.
These periods deserve closer observation because they often represent significant changes in market dynamics.
What does this mean?
These charts do not predict market direction. Instead they help identify whether market behaviour appears:
stable,changing gradually, or entering an unusually different structural regime.
They are intended as an early-warning tool for structural change rather than a price forecast.
| 
 Free Reports